


Many traders are sure that charts have all the necessary information for trading. Therefore, there is no need to add supplementary tools to them such as technical indicators.
At the same time, there are those who think that in order to achieve better data accuracy, applying auxiliary tools is a must. Thus, technical indicators can be added to the price chart or used in a separate window.
If you want to learn more about chart types and their use, the article “Trading charts” will tell you all about that.
How to read graphs
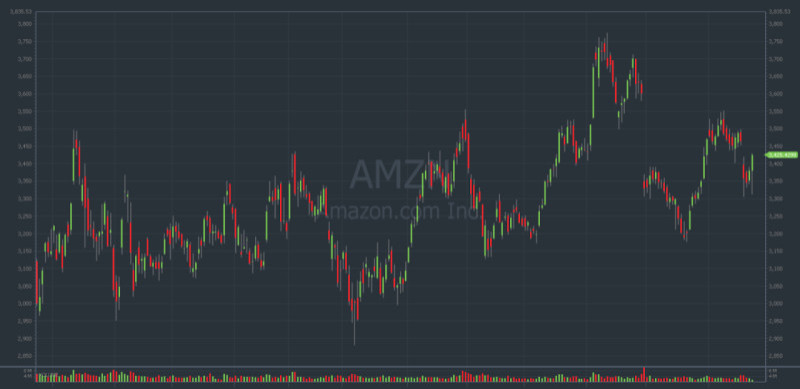
Price charts are a visual presentation of the value of assets. They not only illustrate price movements but also show the general market situation.
With their help, you can track how the price changes intraday or in the course of several years. Such data can be equally useful in various situations and for different users.
The chart consists of two axes: the vertical axis, and the horizontal axis. The horizontal axis depicts time intervals, and the vertical one shows the price scale. Time frames can be specified in minutes, hours, days, months, and so on.
Price charts can be different as well. It all depends on the goals pursued by users. Thus, a linear chart is used when you need a minimalistic chart without unnecessary noise.
It will help you easily determine the current trend. In addition, applying various technical indicators to the linear chart is simple because there is only one plane line on the chart.
Such charts are often used by investors and long-term traders who need basic information about price movements. Active traders need more data. So, they usually choose other ways of displaying information.
A candlestick chart is one of the most common types of charts. For example, in the daily time frame, each candlestick represents one trading day, that is, the opening and closing price of that day, as well as its maximum and minimum intraday values.
Above all else, there are various candlestick types and their combinations, which can show both a trend continuation and a reversal.
Graphic patterns
In addition to candlestick patterns, you can find other formations on charts. These are patterns formed by the price.
The idea of pattern analysis lies in the fact that the market moves in cycles. In other words, patterns repeat at certain intervals.
Despite a breakthrough in technology, human behavior remains the same. That explains why the cyclical nature of markets.
Conventionally, all patterns can be divided into reversal and trend continuation patterns. In particular situations, some formations can be both.
Each pattern has its advantages and disadvantages. Yet, there is one feature that unites them all – subjectivity. That is, each trader, depending on the level of knowledge and experience, can find different formations on the same chart or see none at all.
The thing is that when patterns begin to form, they may look similar to each other. That is why traders should avoid entering the market at the very start of a pattern formation. Although some aggressive traders do just that.
Nevertheless, when a pattern starts to build up, there is no guarantee that it will indicate a trend continuation or a reversal. If you fail to determine this point, you are highly likely to incur losses instead of making a profit.
A conservative trading style implies that you should wait until the pattern is completed. Ideally, it should also return and touch support or resistance.
Trend continuation patterns
To use graphic patterns efficiently, you should detect precisely the current trend. In fact, they can indicate both the future direction of the price as well as entry and exit points.
Each pattern is formed within a certain time. As a rule, the longer the formation takes, the more reliable the pattern is and the stronger its signals are.
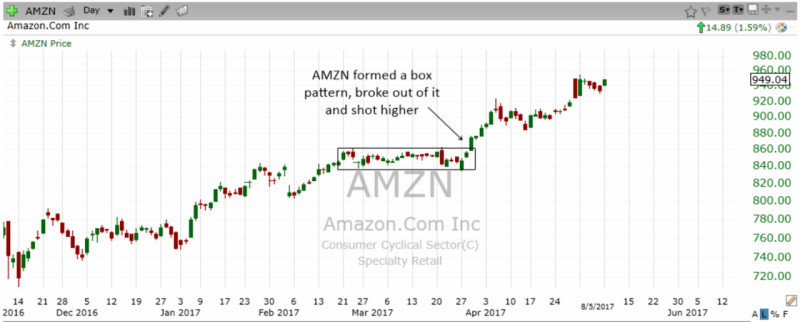
If a pattern resembles one of the trend continuation formations such as a Pennant, a Rectangle, or a Flag, you can trade safely.
Such structures are usually called consolidation patterns because the price moves within a certain range and cannot go beyond it.
Therefore, after several fluctuations -- usually four to ten -- the price leaves the corridor and continues to move in the same direction.
In the course of a pattern formation, the price as if takes a break before extending the trend.
At the same time, if a pattern is not identified properly, a trader will not lose money because the general trend will be determined right.
The Pennant and Flag formations are quite similar. They both have a flagpole, which is a fairly long segment, greatly exceeding the width of the pattern itself.
The Flag is also akin to the Rectangle. Their only difference is that the Flag is angled, while the Rectangle is straight.
Bilateral patterns
Bilateral patterns are quite tricky. Depending on the situation, they can either show a trend continuation or a reversal.
The Triangle is one of them. When it forms, it may resemble the Pennant, which is a trend continuation pattern.
Many traders consider the Triangle to be a trend continuation pattern. However, when the formation of this structure is completed, a reversal may occur.
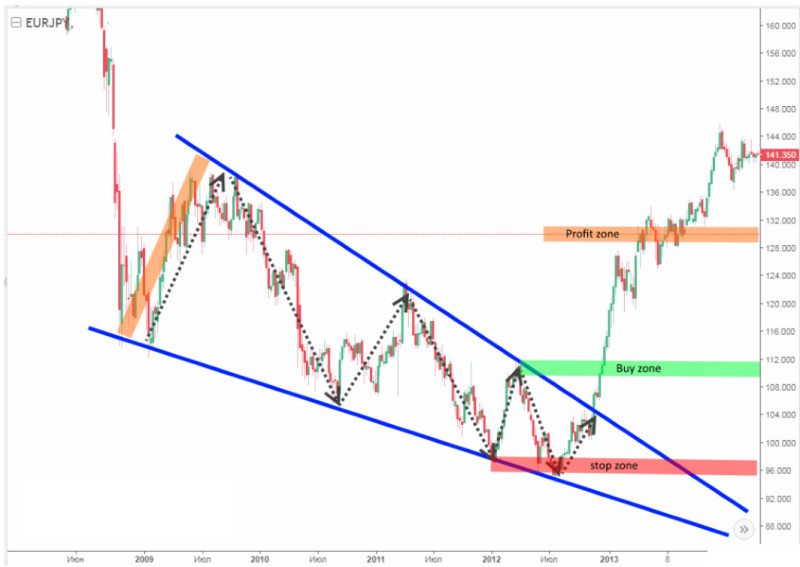
The Wedge is the most common bilateral pattern. It can be of two types: bullish and bearish, with one of them indicating a trend continuation, and the other signaling a reversal.
The Bull Wedge builds up when the market goes higher and resembles a minor correction. In other words, the price fluctuates slightly before breaking through the upper limit of the Wedge and going up again.
The Bear Wedge also forms during an uptrend and is marked by higher highs and deeper lows. That lasts until the price breaks through the lower limit of the Wedge and goes down.
This is an example of how the same pattern can behave differently depending on the situation. Therefore, you should be extremely careful with it.
A Falling Wedge reflects either a continuation of a bullish trend or that it is about to start. At the same time, in order to distinguish this pattern from others, you should also monitor the volume indicator, which is supposed to move up at the time.
Conversely, the Rising Wedge on the chart reflects the continuation of a bearish trend or that it is about to begin.
Reversal patterns
There are believed to be several signs of an impending reversal:
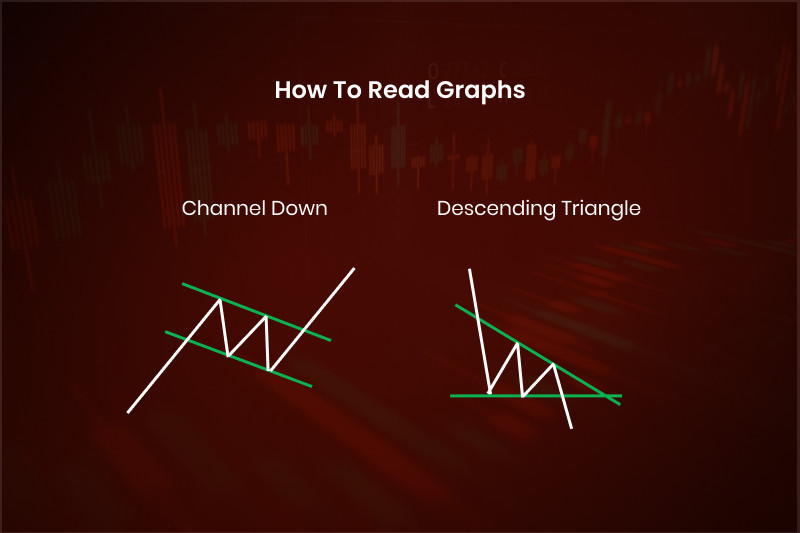
- The price goes beyond the limits of the current channel;
- Highs alternate with lows on the chart;
- The volume indicator is not in line with the price chart;
- Reversal patterns appear.
Before a reversal pattern occurs, the price tends to be in a strong trend. Reversal patterns never form when the market is flat. Otherwise, they are false patterns.
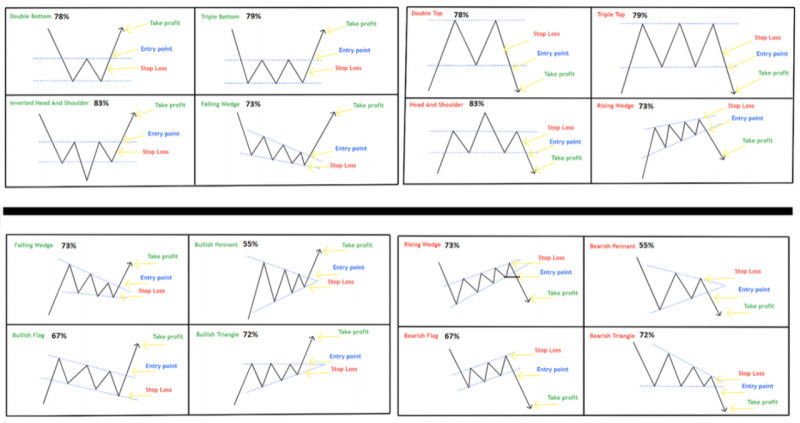
The list of the most common reversal patterns includes:
- Double/Triple Top
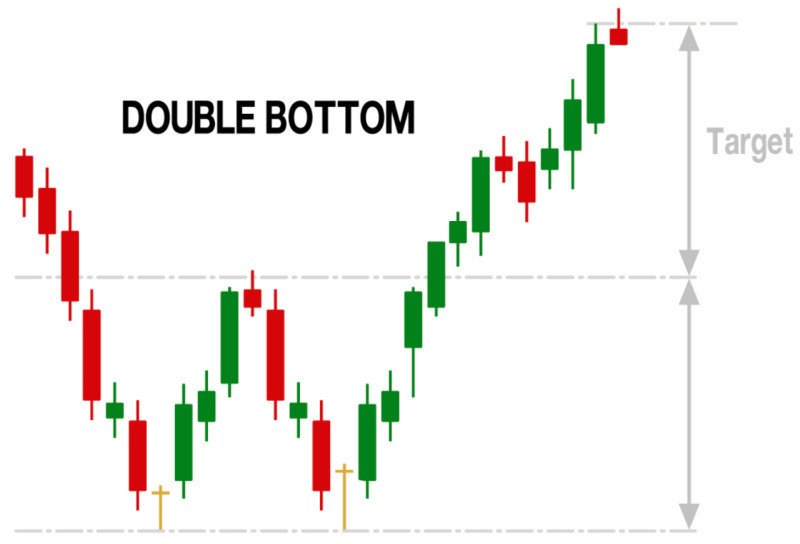
- Double/Triple Bottom
- Head and Shoulders
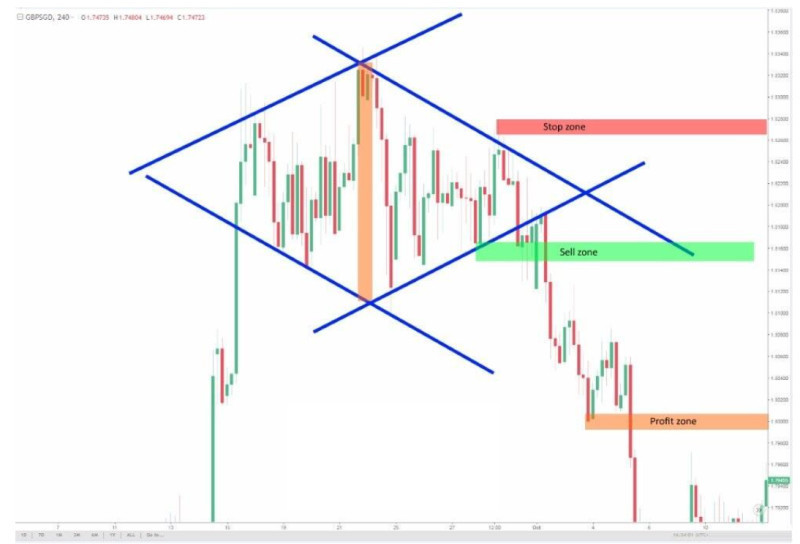
- Diamond
- Cup and Handle, etc.
The first three patterns in this list are the most frequent of them all. They look similar when they begin to build up. Nevertheless, traders do not find it problematic because all of them illustrate a reversal.
The Double Top and Head and Shoulders appear on the chart quite often. The Triple Top is the continuation of The Double Top. However, when they start to form, they look alike, and a prominent peak is their common feature.
The Double/Triple Bottom is a mirror reflection of the Double/Triple Top pattern and shows a bullish reversal.
In fact, a reversal signal is confirmed only when a particular pattern is built up entirely. In addition, the signal should be supported by the volume indicator.
How to read graphs using graphic patterns
Finding patterns on charts is not always a piece of cake. Besides, each trader interprets charts in their own way. Nevertheless, there are some conventional rules that can help detect patterns.
- You should define and plot a trendline. True formations appear on charts only when there is a pronounced trend movement. Thus, you should identify the dominant trend: bullish or bearish.
- When the trendline is drawn, you will be able to see the contours of a certain pattern. Next step, you plot one more line to see the entire formation.
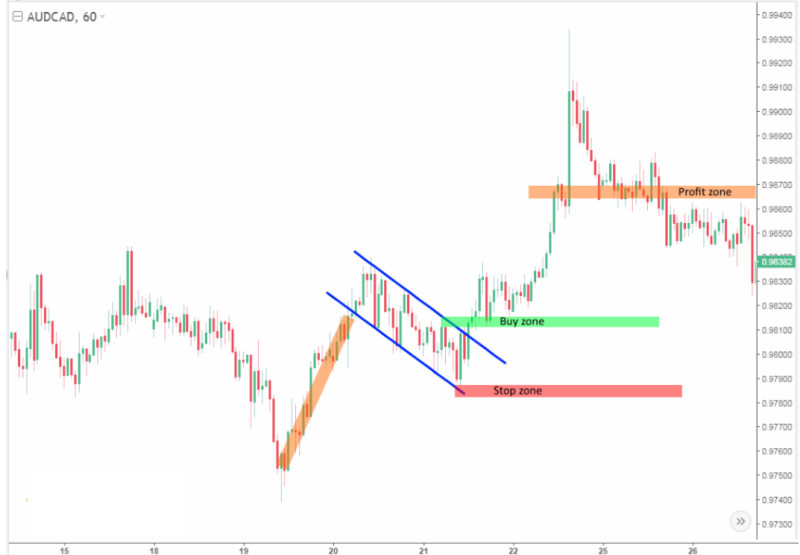
- When the pattern is fully built up, you should look for a point where the line breaks through the limits of the pattern. This particular point is used to open a position in most cases.
How to read graphs, all in all, continuation patterns mostly form when the price moves within the limits of a channel or corridor. Once a breakout occurs through one of the limits of the pattern, the current trend goes on.
When it comes to reversal patterns, to detect one, resistance and support are often used. It is between these levels that reversal patterns usually occur.
In addition, these levels can help you detect a profit target. Oftentimes, a target is determined based on the peak of a graphic pattern.
Savvy traders say you should place a Take Profit at the level of some 75-80% of the peak of a pattern. A Stop Loss should be set at about 15-20% of the lowest point of the pattern.
Advantages and disadvantages of patterns
Advantages of patterns:
- Self-sufficiency. No additional tools are required because all the necessary information is already on the price chart;
- Visual aspect. Patterns are visually highlighted on the charts. Traders only need to correctly identify and use them;
- Order of formation. There are certain rules that explain the formation of each pattern. Those patterns are reliable that build up according to those rules. Otherwise, the signals from such structures should not be trusted.
- Graphic patterns are used equally well in different markets and on charts of various assets. This is due to the fact that the market moves cyclically.
Disadvantages of patterns:
- Subjectivity. Depending on their knowledge and experience, traders can detect or miss formations on charts. Moreover, they can identify various patterns on the same chart.
- Real patterns do not always look perfect, which confuses traders and they struggle to detect them right.
- At an early stage of their formation, patterns may look alike. Therefore, traders may misinterpret them. Thus, if you mistake a trend continuation pattern for a reversal one, you risk losing funds.
How to detect patterns on charts
Although using patterns may seem easy, detecting them on charts may be challenging.
That is especially true for beginner traders who do not have enough experience to identify them right.
The thing is that the novice tent to see formations when there are actually none. There are certain rules guiding the formation of patterns on charts. If they form outside those rules, they are likely to be false patterns.
Time frames are also important. Thus, there are more price fluctuations in lower times. Some of them may even resemble certain graphic patterns.
Nevertheless, those patterns are more reliable and well-formed that take up to several months to build up. Such patterns can be analyzed.
Anyway, even if you use lower time frames, you can always check yourself with the help of a higher time frame. It will show you the market situation from a subjective point of view.
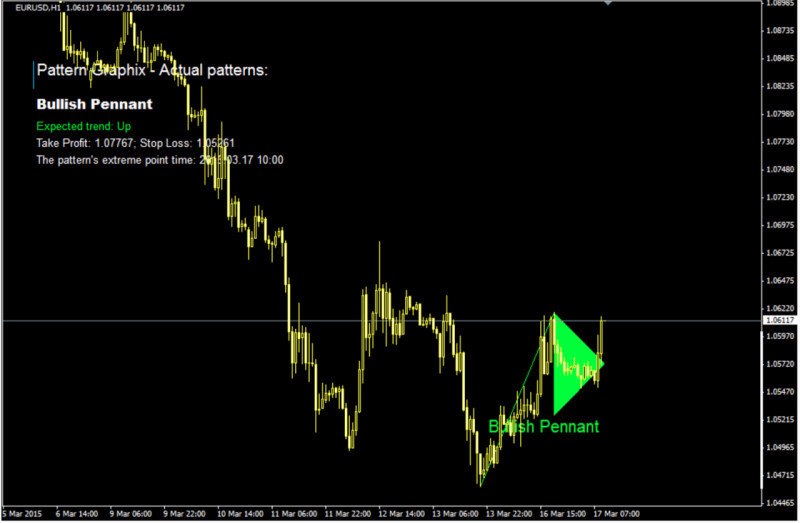
Graphic pattern indicators
The use of graphic pattern indicators is an easier way of finding the right patterns on the chart. These are automated tools that analyze the chart and detect graphic patterns.
When you receive a signal from the tool, it is time to decide whether to open/close a position.
The program searches for patterns based on past quotes and predicts potential formations on the chart.
Traders use the same approach for making a forecast based on available past quotes.
The benefit of such indicators is that they contain a built-in set of patterns to look for on the charts. Meanwhile, for people, it could be a challenge to keep in mind all possible graphic patterns.
Although such programs came along relatively recently, they quickly gained popularity among users. They are compatible with the most commonly used trading platforms and are in the public domain.
Above all else, they are customizable and can be programmed to look for particular patterns. When a formation is found, the indicator makes a signal. In fact, such indicators are highly sensitive and can find patterns even in low time frames.
Yet, traders should check the accuracy of signals coming from graphic pattern indicators.
After all, even a well-formed pattern does not guarantee that it will be processed. Indeed, about 50% of all formations are processed.
In any case, you should always check patterns using filters.
Final thoughts
From this article “How to read graphs”, you have found out how to read charts in order to search for graphic patterns. In fact, many traders believe that charts contain all the necessary information and do not require any additional tools for analysis.
Nevertheless, detecting graphic patterns on the chart may be challenging. Firstly, at the early stage of their formation, one pattern can be mistaken for another.
It is no big deal if you misread patterns from the same group. At the same time, it is riskier when you mistake a reversal pattern for a trend continuation one.
Secondly, each trader may see different patterns on the same chart.
In addition, not all patterns are true and reliable. So, in lower time frames, some formations may turn out to be false.
The most reliable patterns build up within a few months. Accordingly, they can only be detected in higher time frames.
In addition, there are special automated indicators that help traders, especially beginners, to make decisions. They make signals whenever they detect a pattern on the chart.
You may also like
How to read stock charts
How to read investment charts
How to read a stock action
Best indicators for 1 minute chart
How to read a candlesticks chart
Japanese candlestick chart
Candlestick chart


